Developer productivity metrics that survive AI coding agents
A team can ship more code and get less done. That sounds like a provocation until you put Claude Code, Cursor, and similar agents into daily use and watch developer productivity metrics like lines of code, commits, and ticket counts start rewarding the wrong thing. The agent can draft a huge diff in seconds; the real question is whether the first edit was correct, whether it needed three reruns, and how much context it had to re-read before it stopped guessing.
Why lines of code stopped meaning productivity the moment agents started writing code
LOC used to be a bad proxy with a better excuse. Humans typed slowly, review was expensive, and a rough correlation existed between “more code” and “more work.” Once Claude Code is in the loop, that excuse falls apart. The tool can generate a large patch that looks busy, but if it touches the wrong abstraction, misses an ownership boundary, or breaks an API contract, the team pays for the output twice: once to create it, again to undo it.
That is why commit count and PR count are now mostly vanity metrics in an agent workflow. They measure artifacts, not progress. A single PR can contain 800 lines of correct changes, or 800 lines of churn. A dozen commits can be one careful refactor, or a machine replaying the same mistake with slightly different wording.
A concrete example: an agent adds caching to a Flask endpoint, changes three files, and writes tests. The diff is large enough to look impressive. Then review reveals the cache key ignores tenant scope, so the agent reruns. The second pass fixes the key but breaks invalidation. Third pass finally lands the correct behavior. LOC went up every round. Productivity did not.
This is why old developer productivity metrics became theater the moment agents started writing code faster than humans can inspect it. If you want a useful metric, it has to punish rework.
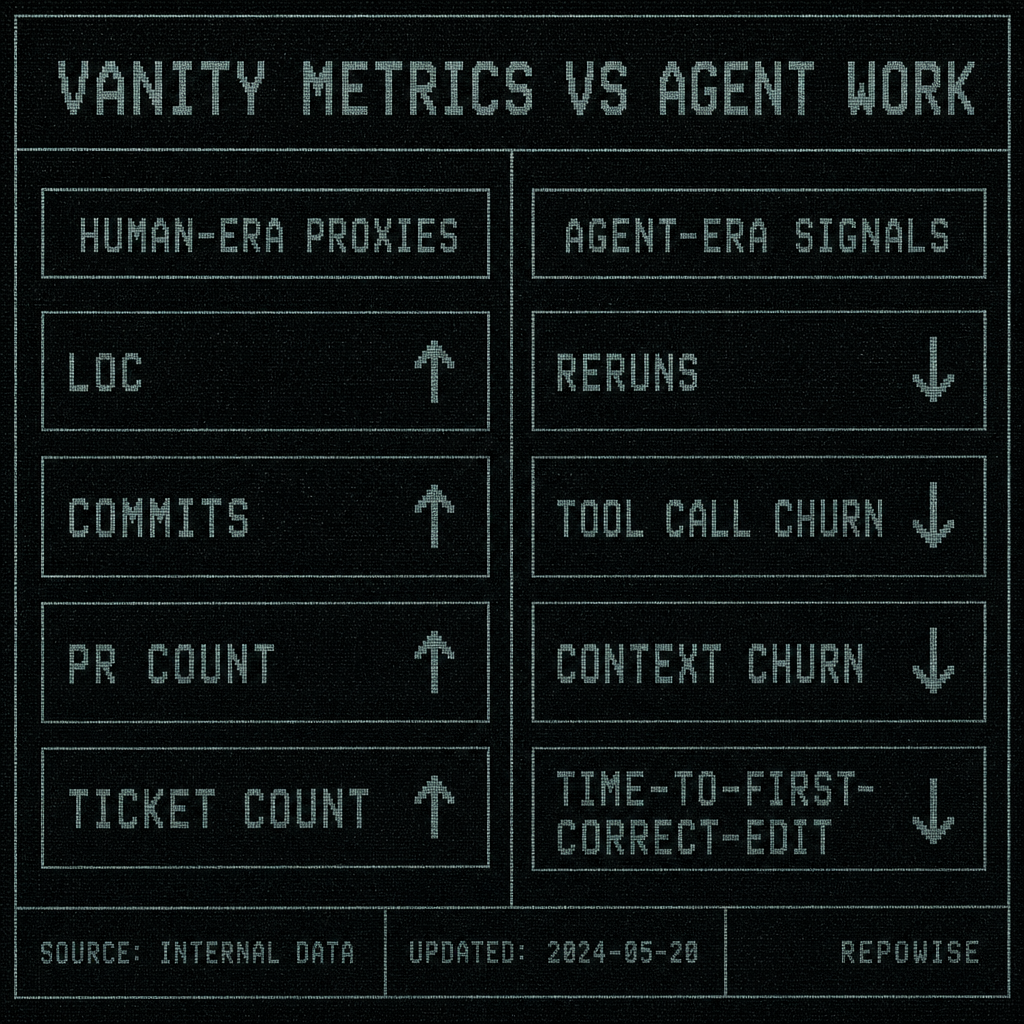 VANITY METRICS VS AGENT WORK
For a broader framing of why output proxies age badly, developer experience metrics is a better place to start than a dashboard full of throughput trophies.
The first metrics agents distort are reruns, tool calls, and context churn
The three failure modes that show up first are easy to define.
Reruns: the same task is attempted again because the first attempt was wrong, incomplete, or based on stale assumptions.
Tool call churn: the agent keeps asking for more context, more files, more searches, or more reads before it can make a useful edit. The session is active, but the work is mostly lookup.
Context churn: the agent re-reads, re-searches, or re-loads the same information because it has lost state or never had the right state to begin with. This is not just token count. A session can be token-efficient and still churn badly if it keeps reopening the same files and reconstructing the same local model of the codebase.
That distinction matters. Tokens are a cost. Context churn is a symptom.
A human engineer often does one-and-done edits: read the issue, inspect the relevant file, change the code, run tests, done. Agent-heavy work is more iterative. The model opens the wrong file, gets a partial answer, asks for another file, forgets the dependency it just saw, and circles back. The session looks productive because the tool is busy. The reality is closer to a confused junior engineer repeatedly asking the same question with different phrasing.
If you want a team-level signal, count the loops. Reruns tell you the agent missed the mark. Tool call churn tells you how much search and read overhead the task required. Context churn tells you whether the system is helping the model retain the shape of the repo or forcing it to rediscover the same facts on every turn.
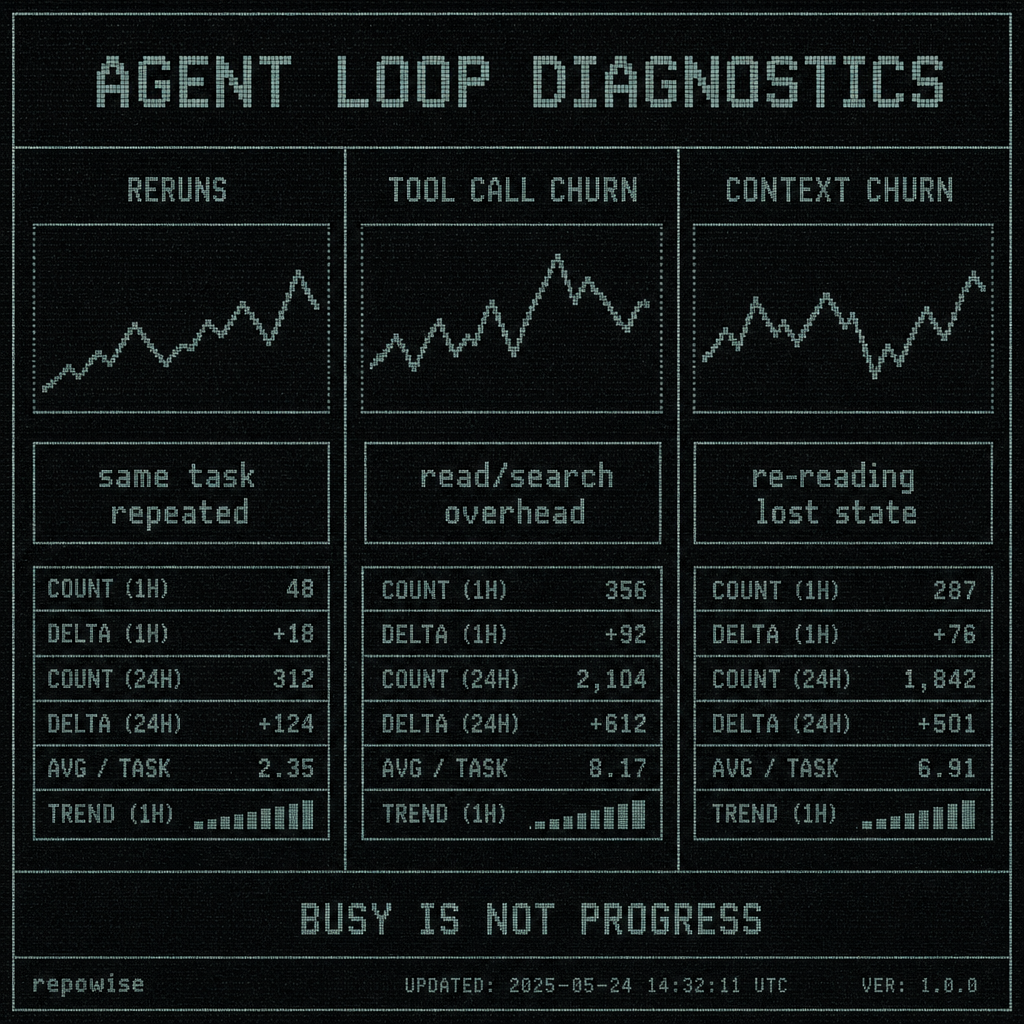 AGENT LOOP DIAGNOSTICS
This is also where tooling matters. A system that injects neighboring files into search, or that surfaces ownership and dependency context before the model asks for it, changes the shape of the session. MCP tool design is usually a better mental model than “let the model search harder.”
A before/after session
Before:
- Claude Code opens
routes.py. - It patches the endpoint.
- Tests fail because the handler depends on a model in another package.
- It searches again, opens the wrong utility file, and reruns.
- It finally finds the owner note and the API contract, then corrects the edit on the third pass.
After:
- Claude Code opens
routes.py. - The workspace context already includes the caller, the owning module, and the contract boundary.
- The first edit is correct enough to review.
Same task. Different waste profile.
That is the real difference between “agent-assisted” and “agent-thrashing.” The second version is not just faster. It is less expensive in the ways that matter.
Time-to-first-correct-edit is the metric that exposes whether the agent helped or just moved faster in the wrong direction
Time-to-first-correct-edit is the elapsed time from task start to the first edit that is both syntactically valid and semantically on target enough that a human reviewer would not ask for a revert.
That definition is stricter than “first edit” and more useful than “time to merge.” A fast bad edit is not productivity. A slow but correct first edit may be fine if the task is complex. What matters is how quickly the session reaches a useful correction point.
Why this beats time-to-merge, cycle time, or raw wall-clock time for agent sessions:
- Time-to-merge mixes review queue, approvals, CI, and release timing with the agent’s actual contribution.
- Cycle time is too coarse; it hides whether the first attempt was wrong and how many loops it took to get back on track.
- Wall-clock time rewards fast mistakes if the team is good at cleaning them up later.
Time-to-first-correct-edit isolates the part of the workflow where the agent either understands the task or wastes your time. If the first correct edit arrives after three reversions, the session was not productive; it was merely active.
A simple way to measure it is to mark the timestamp of task start, then identify the first commit, patch, or editor state that survives review without requiring a revert for correctness. That can be done at the task level, the repo level, or the cohort level. You do not need perfect instrumentation to get value from the metric; you need consistency.
The warning is obvious but easy to ignore: faster first edits are useless if the first correct edit arrives after multiple reversions. That is especially true when the agent can produce a plausible-looking patch in seconds. The model is not the bottleneck anymore. Correctness is.
For teams already using agentic editors, AI coding agents is the category shift that explains why this metric matters more than anything based on typing speed.
A useful team dashboard tracks waste, not just throughput
The dashboard should answer a simple question: did the agent reduce friction, or did it create a new kind of busywork?
A practical weekly set looks like this:
| Metric | What it catches | Why it matters | What a lead changes when it rises |
|---|---|---|---|
| Reruns per task | Failed first attempts | High reruns mean the agent is guessing | Improve task framing, add repo context, split the task |
| Tool calls per resolved issue | Search/read overhead | More calls often means the model is thrashing | Reduce unnecessary searches, enrich context earlier |
| Context churn rate | Re-reading and state loss | Repeated context loss wastes tokens and time | Add better summaries, ownership, and decision history |
| Time-to-first-correct-edit | Time to a useful first pass | Shows whether the agent understood the task quickly | Adjust prompts, context injection, or task size |
| Correction rate | How often the first draft needed meaningful fixes | Captures whether output was usable | Focus on higher-signal context and better review boundaries |
A lead should read this as system health, not performance theater. If reruns spike after a refactor, the likely issue is not “the team got worse.” It is probably a missing boundary, a stale wiki, or a repo layout change that made the agent blind.
A short interpretation example:
- Repo migration happens on Monday.
- Tool call churn rises 40% on the new service.
- Reruns stay flat in the old service.
- Conclusion: the migration broke discoverability, not coding ability.
- Action: update summaries, ownership, and cross-links before blaming the team.
Do not use these metrics for individual ranking or surveillance. That is how you turn a useful instrument into a political weapon. Measure cohorts, repos, or workflow segments. Use the numbers to reduce friction, not to score people.
For teams that already track DORA metrics and SPACE framework, this dashboard is the missing layer that explains why delivery slowed when the agent got “more capable.”
How Repowise-style context changes the numbers you should care about
Better repository context should reduce reruns, tool calls, and context churn. That is the whole point.
If an agent can see the owning module, the co-change history, and the architectural decision behind a file, it is less likely to make a confident wrong turn. A graph edge from a handler to its caller, plus ownership history and the decision record for a boundary, can save an entire loop of “search, guess, patch, revert.” The outcome is not merely fewer tokens. It is fewer wasted loops.
Mechanisms like get_overview and get_context change the workflow by making repo shape available before the model has to infer it. PreToolUse hooks can also inject nearby files when a Grep or Glob starts drifting toward a blind spot, which is useful because the model often does not know what it does not know until it has already asked the wrong question. PostToolUse hooks help when a commit makes the wiki stale and the agent needs to stop trusting outdated context.
That is the kind of change that should move your metrics in the right direction: lower reruns, lower tool call churn, lower context churn, shorter time-to-first-correct-edit. The goal is fewer wasted loops, not just fewer tokens.
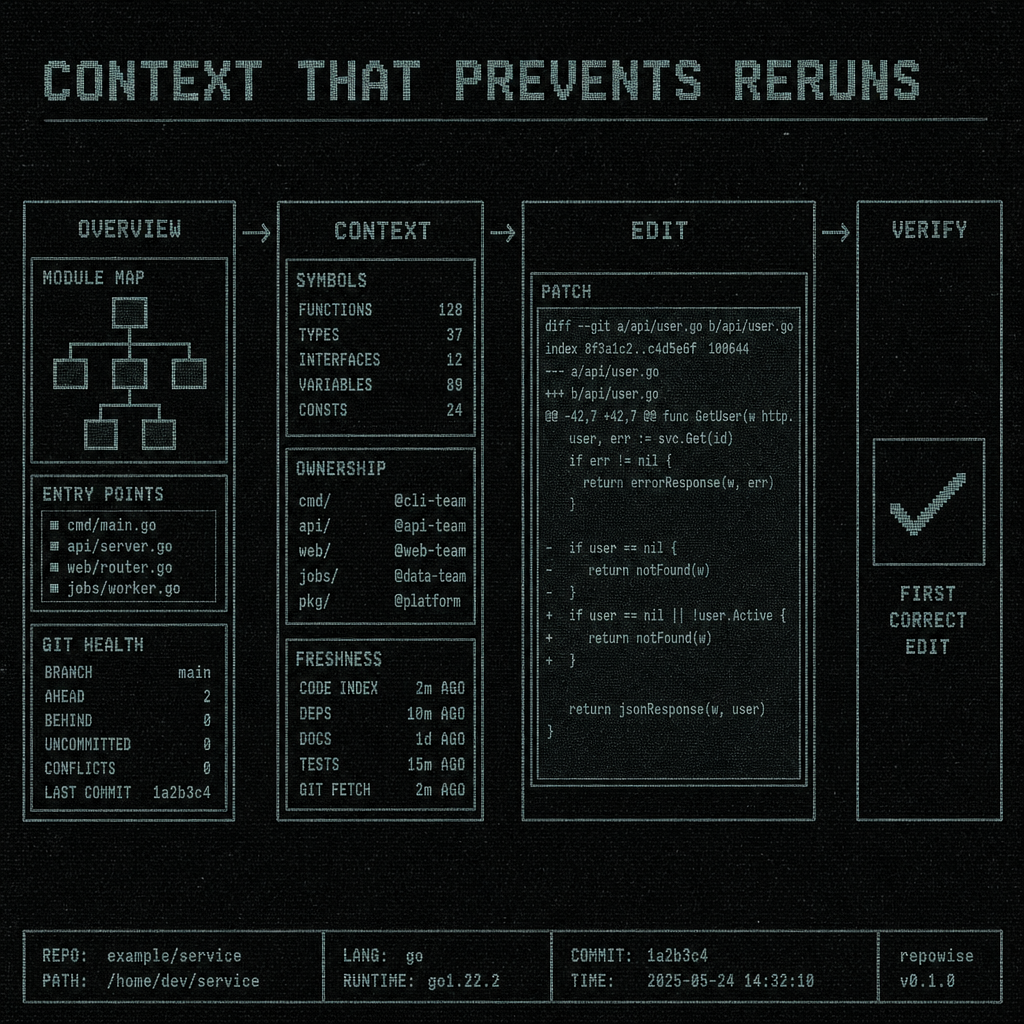 CONTEXT THAT PREVENTS RERUNS
A concrete implementation reference: tools like Repowise expose context, ownership, and decision history through task-shaped MCP calls, while hooks and workspace intelligence reduce the odds that the agent has to rediscover the same facts every time. The product detail matters less than the effect on the session.
If you want to compare the shape of the problem to the shape of the solution, code review workflow is a useful adjacent topic because review is where bad first edits become visible.
What to measure next if your team already has DORA and SPACE
DORA and SPACE still matter. They answer different questions.
DORA tells you about delivery performance: lead time, deploy frequency, change failure rate, and recovery. SPACE gives you a broader view of satisfaction, performance, activity, communication, and efficiency. Neither was built specifically for agent-heavy coding sessions, which is why they miss the waste that now sits between “idea” and “correct edit.”
A useful mapping looks like this:
- DORA: keep it for delivery and reliability.
- SPACE: keep it for broader team health.
- Agent-era additions: reruns per task, tool calls per resolved issue, context churn rate, time-to-first-correct-edit, correction rate.
Start with one or two metrics, not five. If your team has no baseline, begin with reruns per task and time-to-first-correct-edit. Those two usually reveal enough to find the worst friction fast. Add context churn once you can instrument repeated reads or searches consistently.
Keep the aggregation at cohort, repo, or workflow level. A dashboard that ranks individuals by tool calls is not a productivity dashboard. It is a surveillance system with nicer typography.
The practical goal is simple: measure whether the agent is helping the team reach correct code faster, with less rework. If the numbers move, you will know whether the bottleneck is task framing, repo context, or the agent itself.
FAQ
What are the best developer productivity metrics for AI coding agents?
The best developer productivity metrics for AI coding agents are the ones that expose waste: reruns per task, tool calls per resolved issue, context churn rate, time-to-first-correct-edit, and correction rate. They tell you whether the agent is helping the team reach a correct change faster, not just producing more text.
How do you measure developer productivity without using lines of code?
Stop measuring output volume and measure correction efficiency. Track how many attempts it takes to get a correct edit, how much search and rereading the session required, and how long it took to reach the first useful change. That gives you a much better signal than LOC, commits, or ticket counts.
What is time-to-first-correct-edit in software engineering?
Time-to-first-correct-edit is the time from task start to the first edit that is correct enough to survive review without a revert for correctness. It is useful for agent-assisted coding because it isolates whether the model understood the task early or needed multiple correction loops.
How do you track tool call churn in Claude Code or Cursor?
Track the number of tool calls required to resolve a task, then look for repeated searches, repeated file opens, and repeated context requests within the same session. In Claude Code or Cursor, the exact instrumentation will differ, but the signal is the same: if the agent keeps asking for context it already had, tool call churn is rising.
Why are lines of code a bad productivity metric for AI coding agents?
Because agents can generate large diffs quickly, including wrong ones. LOC rewards volume, not correctness, and in an agent workflow the expensive part is usually the correction loop. A smaller correct edit is often far more productive than a larger generated diff that needs three passes to fix.