On this page
Across 21 open-source repositories and 9 languages, ranking files by repowise's code-health score reaches a cross-project mean ROC AUC of 0.74 [95% CI 0.68-0.79] at predicting which files get bug-fixed over the following six months. Under a fixed review budget, that ranking surfaces 2.3x more real defects than a size-ordered baseline, and the lowest-health files carry 2.18x the defect density of the average file. Every marker is open source, and the benchmark runs on your own repository, so this is a result you can reproduce rather than take on faith.
The honest version of the question is uncomfortable. People put a single 0-to-10 number in dashboards and PR gates and then act on it. So before trusting it, you have to ask whether the score actually points at the files that break, or whether it is a well-dressed line count.
This is a methods writeup of the benchmark we built to answer that. It includes the numbers, the controls that try to kill the result, and the limits of what "ROC AUC 0.74" is allowed to claim.
What we measured
We tested one claim: does ordering a repository's files by code-health score put the files that actually receive bug-fixes near the top of the list? Concretely, we score every file at a point in time, wait six months, label a file "defective" if a fix: commit lands on it, and measure how well the earlier score ranked those files. Prediction precedes the label.
Methodology
The corpus is 21 open-source repositories spanning all nine of repowise's full-tier languages: Python, TypeScript, JavaScript, Rust, Go, Java, Kotlin, C++, and C#. That comes to 2,770 source files carrying real, commit-derived defect labels.
The scoring is deterministic. The code-health score is built from 21 markers with no model and no LLM in the loop, so identical inputs always produce an identical score. There is nothing to overfit and nothing to seed.
The labels come from history, not opinion. A file is "defective" if a conventional-commit fix: touches it inside the measurement window, an SZZ-style attribution that ties the label to a real change a maintainer shipped.
The trap this design avoids is leakage. Several strong markers are evolutionary: they read recent git history like churn, author count, and change entropy. A bug-fix is itself a commit that bumps exactly those signals. So we score in the past: check out the last commit on or before a fixed date in a detached worktree, score that, and draw labels strictly from the window afterward. Measurement precedes labels, so no future fix can reach back and inflate the score.
We report two metrics, because they answer different questions. ROC AUC measures raw discrimination: the probability a random buggy file outscores a random clean one. Effort-aware recall (and its summary, Popt) measures something a reviewer actually cares about: under a fixed inspection budget in lines of code, how many real defects do you catch?
Results
The head-to-head below compares health-ranked review against a size-ordered baseline on the same corpus, same labels, same budget.
| Metric (fixed review budget) | Code health | Size-ordered baseline |
|---|---|---|
| Recall @ 20% of lines reviewed | 0.173 | 0.074 |
| Effort-aware Popt | 0.607 | 0.462 |
| Defect density (lowest-health files) | 2.18x | 0.56x |
| ROC AUC | 0.731 | 0.705 |
Scroll the table sideways to see every column.
The recall row is the practical headline. Spend the same review budget, and health-ordered review finds 0.173 of defects against 0.074: 2.3x more real defects under a fixed review budget, a figure attributable to this open 21-repo benchmark.
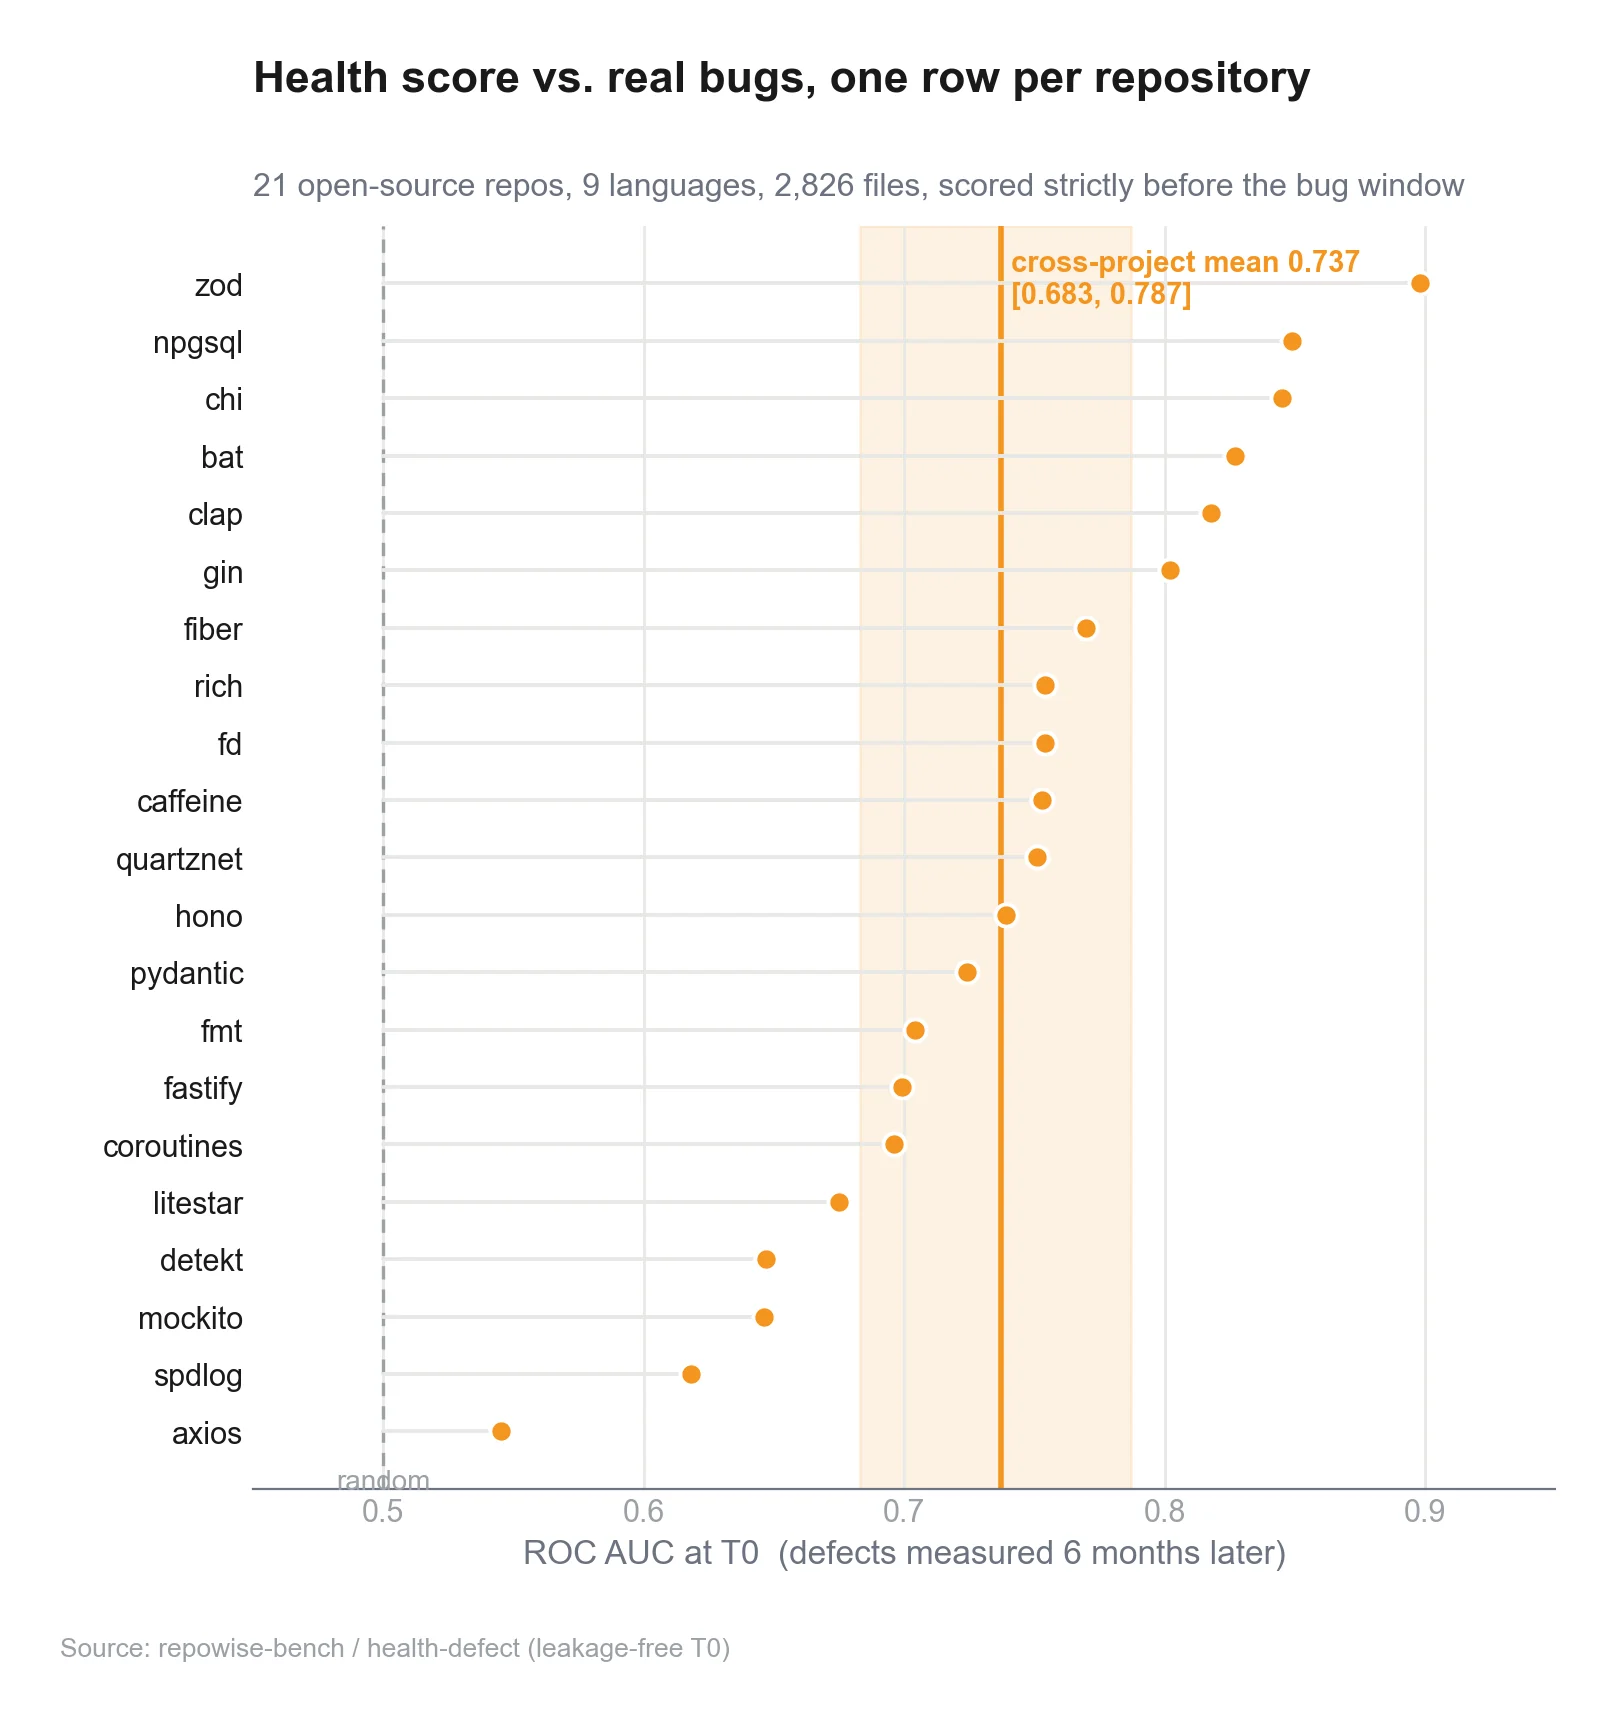
Across all 21 repos, the resampled cross-project mean ROC AUC is 0.74 [95% CI 0.68-0.79], rising as high as 0.90 within a single, structurally varied repo. We resample repositories rather than files, because the thing you generalize to is a new repo, not another file in one you have already seen.
 Per-repository ROC AUC across the full 21-repo corpus
Each dot is one repo. zod at 0.90 is a gift: small, clean, structurally varied. axios at 0.55 is a punishment, a micro-library where so much of the surface was touched in the window that there is almost nothing clean left to discriminate against. The spread from 0.55 to 0.90 is real, which is why we quote no single repo.
 Health versus the trivial baselines on AUC and Popt
The size comparison is worth stating in both directions, because they disagree. On raw AUC the score ties a pure line-count baseline, 0.737 against 0.742, with a paired DeLong test at p = 0.92. Raw AUC rewards size, though: big files genuinely carry more bugs, so "always guess the big file" scores well on it. Under Popt, where reading big files costs what it costs, the score beats line count by +0.134 [0.080, 0.198].
The score survives the controls that usually sink defect predictors:
- It is not file size in a trench coat. After controlling for file size, a partial Spearman correlation of -0.16 still excludes zero. The score carries signal beyond line count.
- It out-discriminates recent churn by +0.10 AUC and prior-defect history by +0.12 AUC, each with a paired DeLong test at p < 1e-9. "What changed lately" and "what broke before" are both weaker separators than structural health.
- The tail is concentrated where it should be. On a typical repo, 16 of the 20 lowest-health files had received a bug-fix in the prior six months, 3.3x the 24% base rate across all files.
Where it fails, in detail
A score is only trustworthy if you know where it breaks, so we sliced the errors by file size.
 ROC AUC computed strictly within file-size bands
This is the least flattering chart in the study. Compute AUC within a single file-size band, holding the size advantage constant, and most of the signal evaporates. On large files, the top two quartiles, the score discriminates fine at around 0.67. On the smallest files it is weak, and on the 29-to-68-line band it inverts below random. The worst false negatives are all small files with zero findings: every marker gate needs some size or activity to fire, so a tidy 40-line file that is nonetheless buggy gives the score nothing to grab. It is structurally blind to small files.
The Q2 inversion had a specific cause. Two markers, primitive_obsession and dry_violation, fire constantly on small modules where that shape is idiomatic and harmless, and there they are anti-correlated with bugs, while the genuine small-file predictors barely fire at all. That diagnosis led to a narrow gate fix — primitive_obsession now only fires in modules of 60 or more non-blank lines — which nudges the Q2 band back above random without regressing anything, validated by re-scoring the cached findings rather than guessed at.
Did we just get lucky with the date?
A single measurement date could be a fluke window, so we re-ran the whole leakage-free pipeline at three rolling six-month start dates, re-indexing every repo at each one.
 Cross-project mean AUC across three rolling measurement windows
The three came out at 0.771, 0.703, and 0.754, a mean of 0.743 that brackets the full-corpus figure. Individual repos wander between windows — hono swings from 0.54 to 0.72 as its in-window bug set changes — which is exactly why the headline is a cross-project mean over a diverse corpus and not any single cell.
We also re-ran everything under a different labeling strategy: leakage-free SZZ, which git blames each fix back to the commit that introduced the buggy line and counts only files whose bug already existed at the measurement date. SZZ strips 17% of the keyword labels as noise, yet the measured accuracy barely moves (mean AUC 0.744 against 0.734) and every significance verdict reproduces. The score predicts "where bugs originate" about as well as "where fixes land".
One out-of-distribution check
Everything above is our corpus and our labels. To place the score against the field, we ran it on a dataset it has never seen and we did not build: the PROMISE/Jureczko jEdit benchmark, the canonical CK-metrics-plus-post-release-bugs set that hundreds of defect-prediction papers use. On a single-release snapshot there is no git history, so only the structural half of the score runs and the strongest evolutionary markers contribute nothing. Even so it lands at AUC 0.76 and 0.78 across two releases, within about 0.03 of the dataset's own cross-validated full-CK-metric model, and again beats line count on Popt. One project, structural-only, so we will not oversell it — but it is an external check rather than a home-field number.
Limitations
A benchmark you can't break is a benchmark you can't trust, so here is where this one bends.
Label leakage is the central hazard, and scoring-in-the-past mitigates but never fully eliminates it. A file's structure six months ago still correlates with the activity that produced its fixes, so some shared cause leaks into both sides. We anchor evolutionary windows to the real repo head to stop the windowed markers from silently reading the answer key, but residual correlation is real.
Repo selection is criteria-driven, not random. A repository had to index inside a time budget, use Conventional Commits cleanly, and produce at least five defect-bearing files in the window. Dead repos that yield almost no fixes were excluded as all-negative noise, a decision made before scoring, but a decision nonetheless.
And ROC AUC 0.74 is a ranking claim, not a verdict. It says the score reliably orders files better than chance and better than the trivial baselines. It does not say any single file is doomed, that 0.74 is a ceiling, or that the score replaces a reviewer. On pure triage ordering, prior-defect history wins on Popt, 0.609 against 0.524: "re-inspect whatever broke before" remains a brutally effective and nearly free heuristic, and the score does not beat it at raw bug-finding-per-line. What the score adds is discrimination plus an attributable, structural explanation of which of 21 measurable things are wrong. A rap sheet only tells you the file has broken before. Those are different jobs.
Reproduce it
This is the part most defect-prediction claims skip. Every one of the 21 markers behind the score is open source under AGPL-3.0 (49 in total across all three health pillars), the scoring is deterministic, and the benchmark harness runs against your own repository rather than a curated corpus you have to trust.
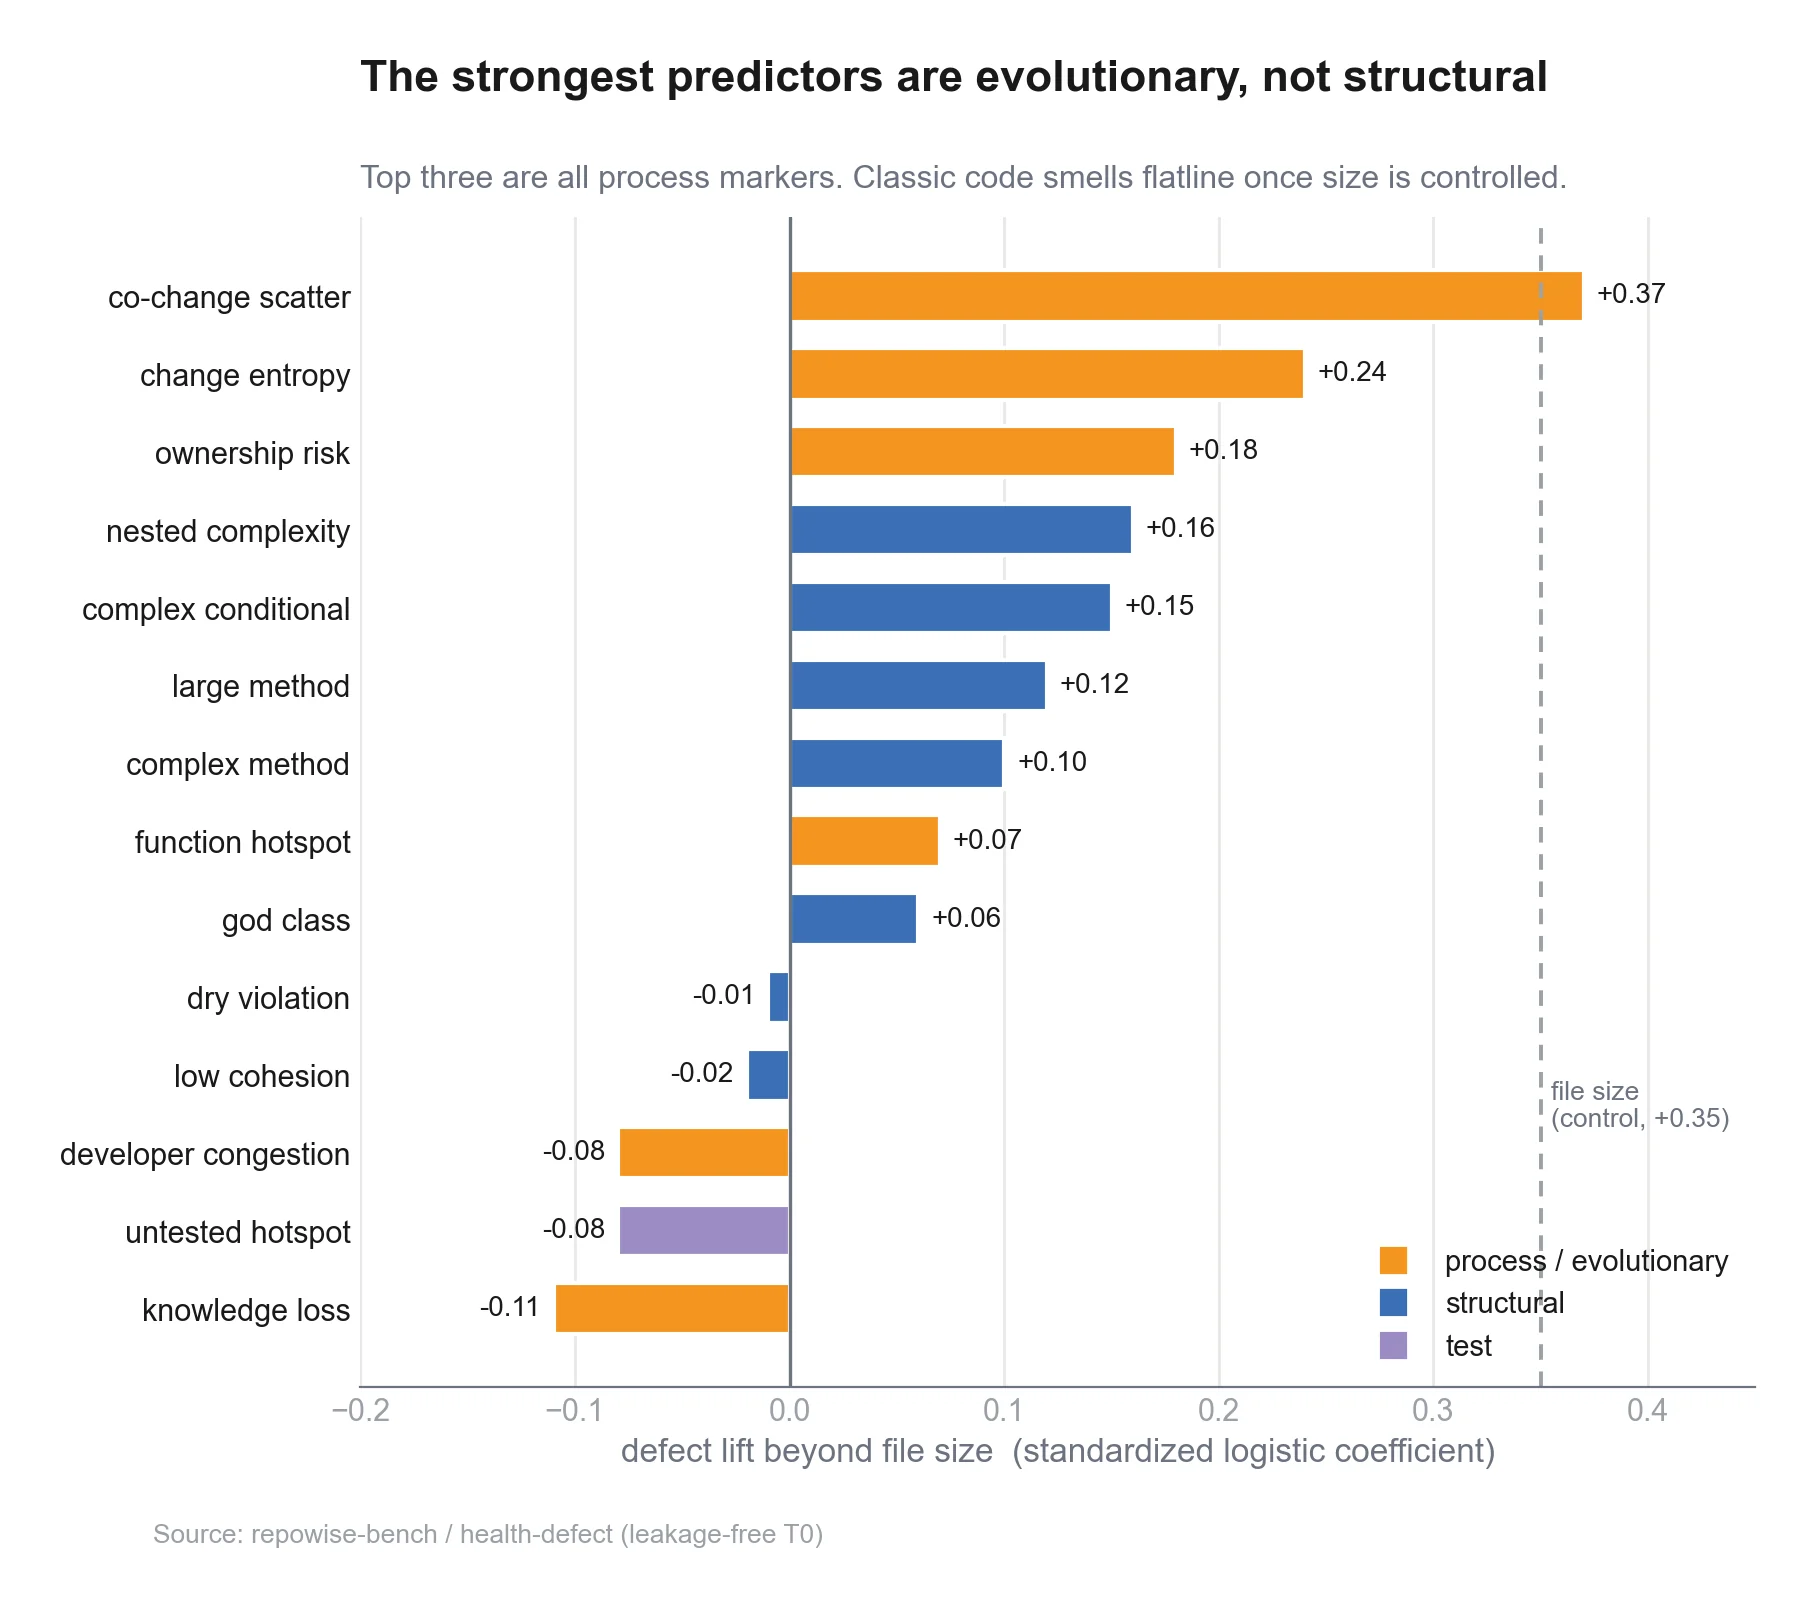
You can index any repo and read the same per-file scores the benchmark consumes, then check them against your own fix: history. The full marker definitions and the three-pillar breakdown live in the code health feature page and the pillar guide, Code Health: The Complete Guide. Which of the markers actually carry the prediction is its own result, written up in why process metrics beat structural metrics.
If you are weighing repowise against a closed scorer you cannot inspect, the CodeScene alternative comparison lays out what "reproducible" buys you over a black box. The short version: a score you can audit, run yourself, and falsify is worth more than a higher number you have to believe.
Last reviewed: June 2026
FAQ
Does code health actually predict bugs?
Yes, with a measurable and reproducible effect size. Across 21 repos and 9 languages, ranking files by repowise's code-health score reaches a cross-project mean ROC AUC of 0.74 [95% CI 0.68-0.79] at predicting which files get bug-fixed over the next six months, and surfaces {{fact:health_defect_lift_vs_codescene}} more defects than size-ordered review under a fixed budget.
What does ROC AUC 0.74 mean here?
It means that if you pick one buggy file and one clean file at random, the buggy one scores worse 74% of the time. It is a ranking quality measure, not a per-file verdict: 0.5 is a coin flip and 1.0 is perfect separation, so 0.74 is solid, useful discrimination across a diverse corpus.
Is the score just measuring file size?
No. After controlling for file size, a partial Spearman correlation of -0.16 still excludes zero, so the score carries defect signal beyond line count. Under an effort-aware budget, where "just read the big files" is correctly penalized, health-ordered review beats a size baseline outright.
How do you avoid label leakage in the benchmark?
By scoring in the past. We check out each repo at a fixed earlier date, score it there, and only then draw `fix:`-commit labels from the window that follows. Because measurement precedes the labels, no future bug-fix can inflate the evolutionary markers it would otherwise contaminate.
Can I reproduce this on my own repository?
Yes. All 21 defect-risk markers are open source under AGPL-3.0, scoring is deterministic, and the benchmark runs against your repo rather than a fixed corpus. Index your codebase, read the per-file health scores, and validate them against your own bug-fix history.
How is this different from a closed commercial code-health tool?
The defining difference is reproducibility. A leading commercial tool gives you a number you cannot audit; this benchmark gives you open markers, deterministic scoring, and a harness you can run and falsify yourself. The {{fact:health_defect_lift_vs_codescene}} defect-finding result is attributable to this open 21-repo study, not to a marketing claim.